We compiled immigration data from multiple sources, including Syracuse University’s TRAC data and the Wisconsin Department of Corrections to determine when and how detainers are being issued from the Wisconsin county level to the national level.
Presidential Administrations
Using the TRAC data, we wanted to compare how many people were deported nationally and in Wisconsin during the two most recent presidents’ first full year in office.
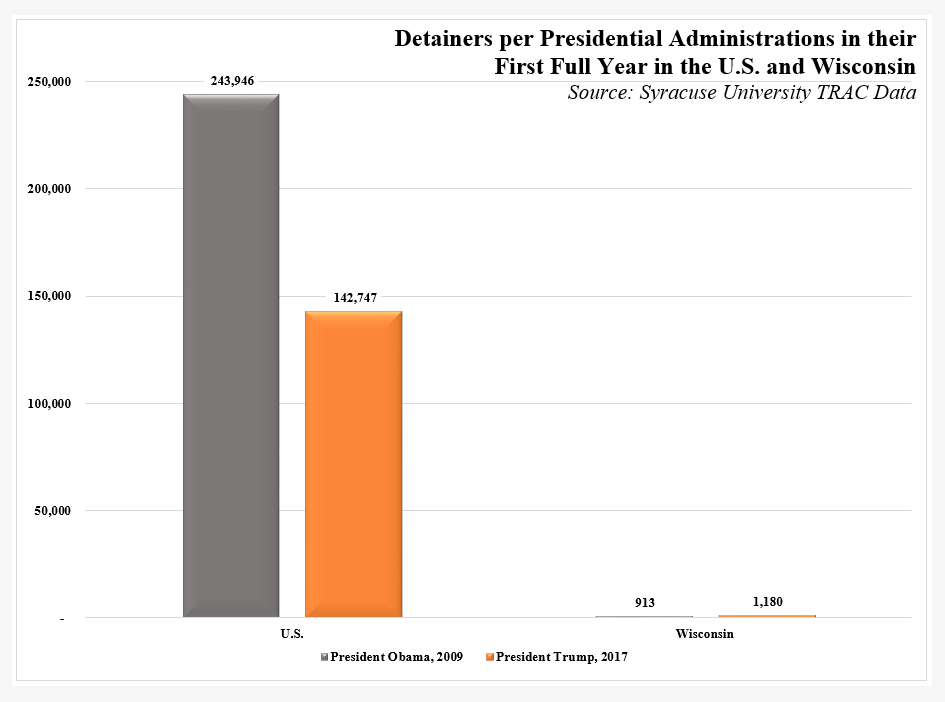
For President Obama, that was 2009, while for President Trump, that was last year in 2017.
During President Obama’s first full year in office, 101,199 more people were issued detainers than during President Trump’s first full year in office.
However, during President Trump’s first year in office, 267 more people in Wisconsin were issued detainers.
Detainers Issued by Region, 2017
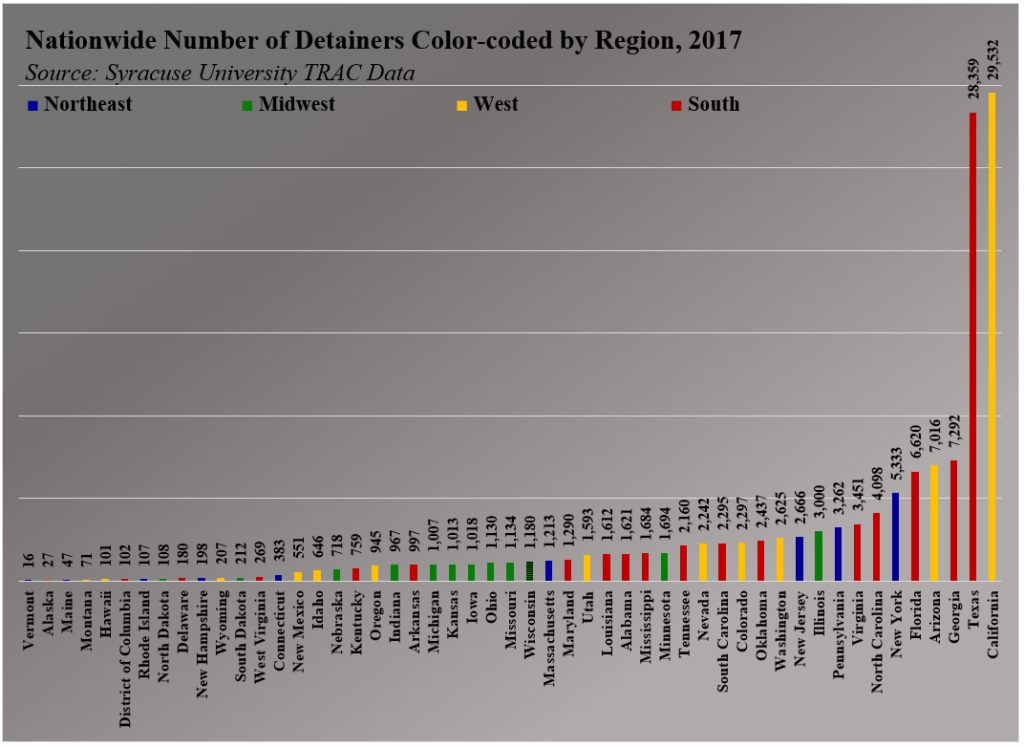
Once again, TRAC data demonstrated that the most detainers were issued in the southern and western areas of the country during 2017. A closer look at the top ten and bottom ten reveal which regions incur the most detainers.
Top Ten
Five southern states (Texas, Georgia, Florida, North Carolina and Virginia) dominated the top ten with 49,820 total detainers. Although there are only two western states (California and Arizona) in the top ten, they made up 36,548 of the detainers issued in 2017.
In a distant third, only two northeastern states (New York and Pennsylvania) from the top 10 were home to 7,999 detainers. In comparison, only one midwestern state, Illinois, made it in the top ten with 3,000 detainers.
Border States with Mexico
California, Texas, and Arizona were all included in the top 10 and 64,907 total detainers were issued there. Interestingly, there were only 551 detainers issued in the fellow border state of New Mexico.
Bottom Ten
Four northeastern states (Vermont, Maine, Rhode Island and New Hampshire) made up the bottom ten with 368 total detainers. Two southern states (D.C. and Delaware) had the second-most detainers in the bottom ten with 282. One lone western state, Montana (71), was in the bottom ten as well as one lone midwestern state, North Dakota (108). Alaska (27) and Hawaii (101), which are not part of the mainland, rounded out the bottom ten.
Wisconsin’s National Ranking, 2017
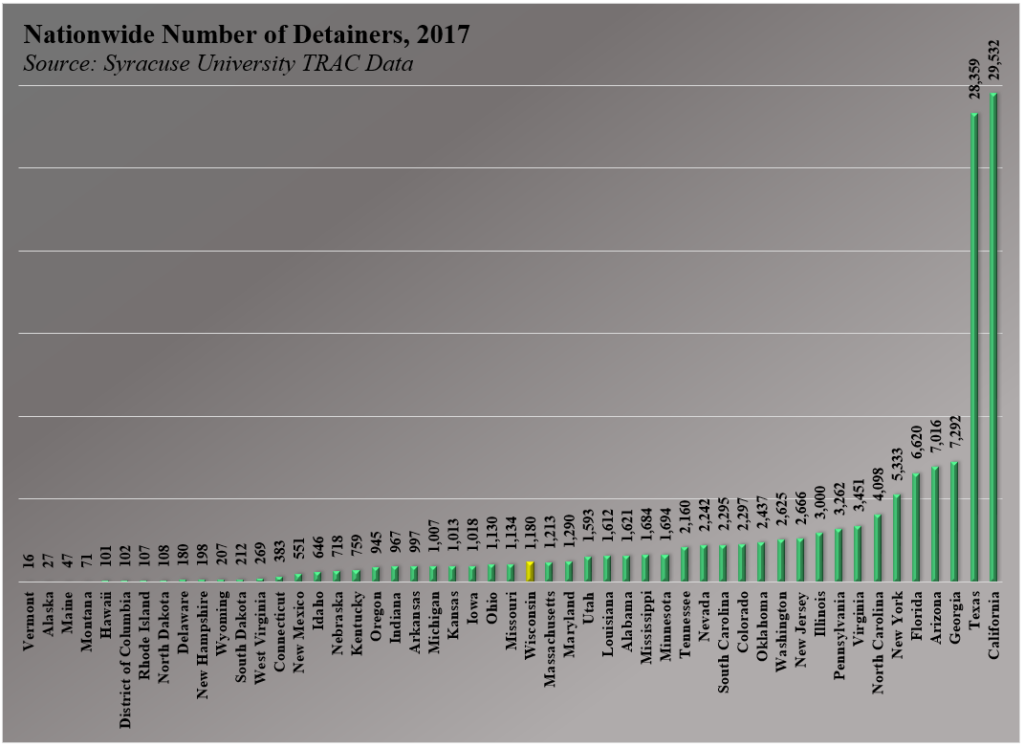
Wisconsin is literally in the middle of the pack – 25th in the nation – in terms of how many detainers were issued nationwide in 2017.
Detainer Rates by Population, 2017
Using Census Bureau and TRAC Data, we compared how many detainers were issued against the population of each U.S. state.
For context, California and Texas were the most populated states in the country (39,536,653 and 28,304,596 and respectively) in 2017, while Wyoming and Vermont were the least populated states in the country (579,315 and 623,657, respectively) in 2017.

Four states – Texas, Arizona, California and Georgia – which were all included in the top ten states with the most detainers issued were also in the top ten states with the most detainers issued per 10,000 people. Texas and Arizona were highest, issuing 10 detainers per 10,000 people.
Seven states – Vermont, Maine, Rhode Island, Montana, North Dakota, Alaska and Hawaii – which were all included in the bottom ten states with the least detainers issued were also in the bottom ten states with the least detainers issued per 10,000 people. Vermont was lowest, issuing 0.26 detainers per 10,000 people.
Wisconsin, which had a population of 5,795,483, was 33rd on the list with about two detainers being issued per 10,000 people in 2017.
Detainers per Wisconsin County, 2005-2018
Using TRAC data, we developed a histogram to conduct a comparative analysis on how many detainers there were per county.
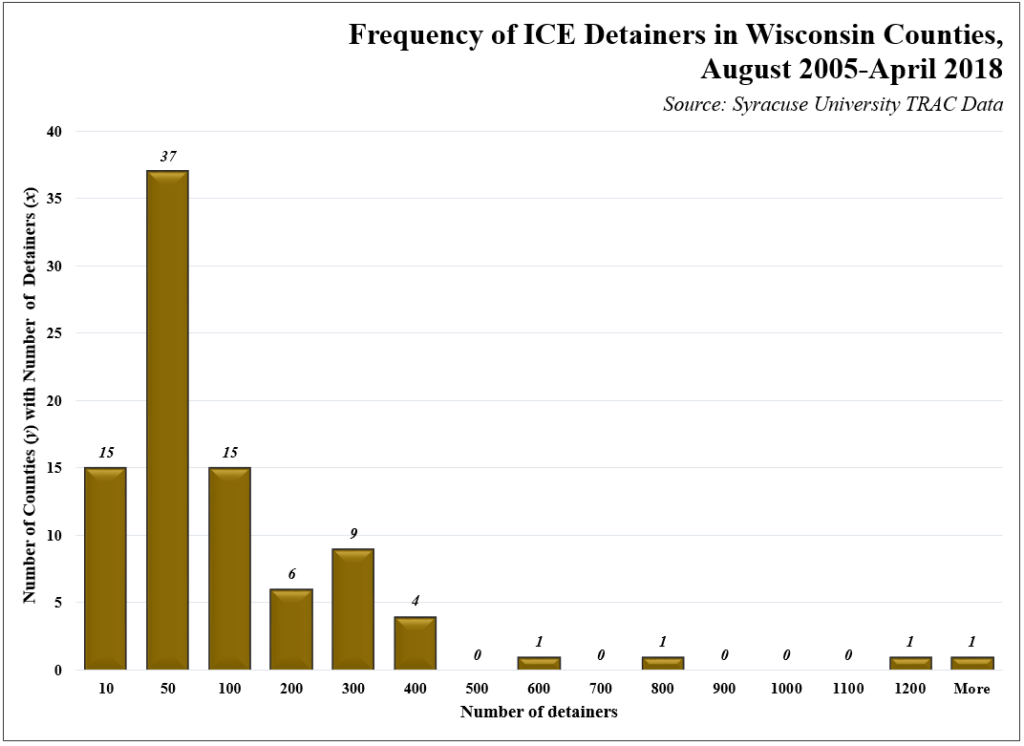
Simply put, there were 15 counties with between 0 and 10 detainers. The remainder of the data is listed below:
- There were 37 counties with between 11-50 detainers
- There were 15 counties with between 51-100 detainers
- There were six counties with between 101-200 detainers
- There were nine counties with between 201-300 detainers
- There were four counties with between 301-400 detainers
- There was one county with 501-600 detainers, one county with 701-800 detainers, one county with 1101-1200 detainers and one county with more than 1200 detainers.
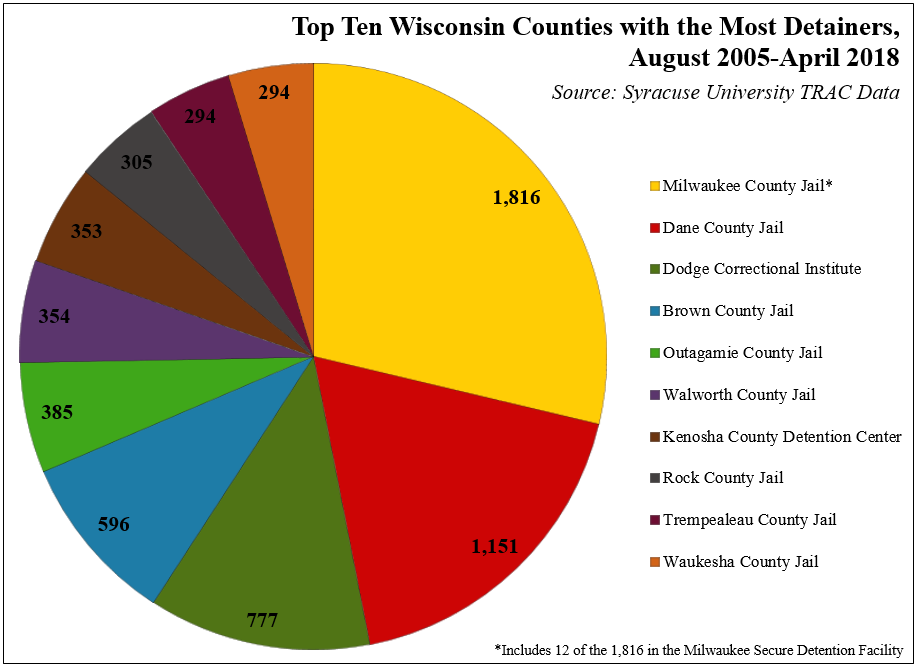
Wisconsin Counties with the Most Detainers, 2005-2018
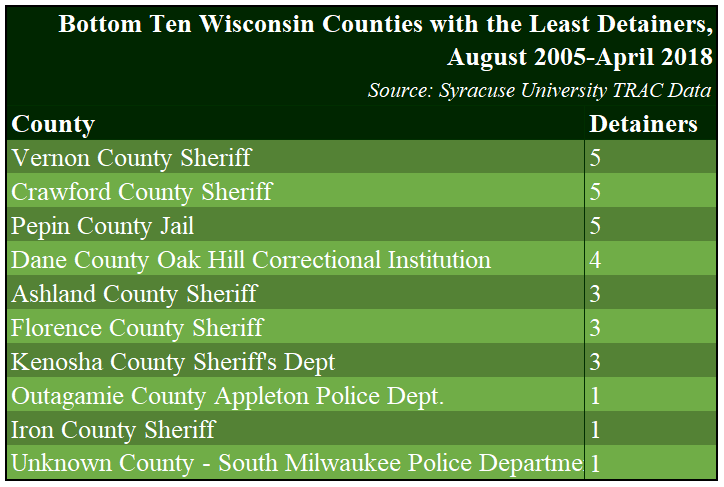
Wisconsin Counties with the Fewest Detainers, 2005-2018
ICE Detainers in Midwestern States, 2005-2018
Wisconsin is 12th among midwestern states in terms of how many detainers have been issued from 2005-2018 and last among all states which touch Wisconsin’s borders (Minnesota, Michigan, Iowa and Indiana)
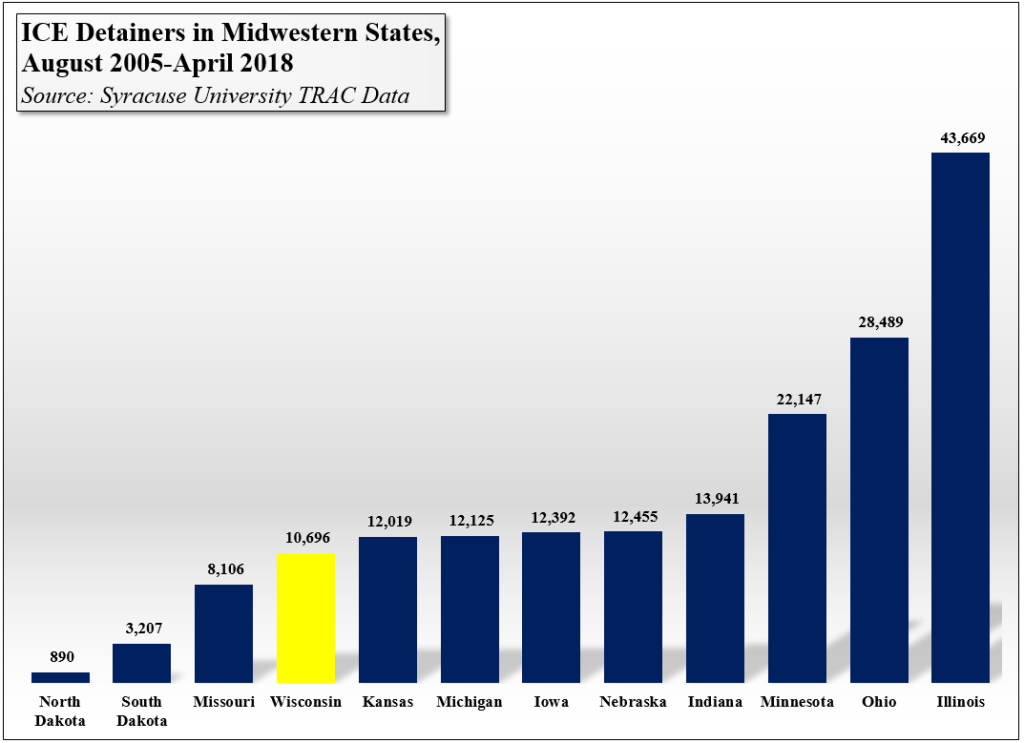
Over the past 14 years, there have been 764 detainers issued on average per year in Wisconsin.
Also, over the past 14 years, the state of Wisconsin has had 32,973 fewer detainers than Illinois (the leader in Midwestern states) and 9,806 more than North Dakota (the Midwestern state with the least detainers).
Note, this parallels data from the year 2017, which demonstrated that the least detainers were issued in North Dakota (108) among midwestern states and the most detainers were issued in Illinois (3,000).
Frequency of Felonies, 2017-2018
Using records from Wisconsin’s Department of Corrections, we developed another histogram to determine how many Wisconsin state prisoners who had been issued detainers were found guilty of committing felonies.
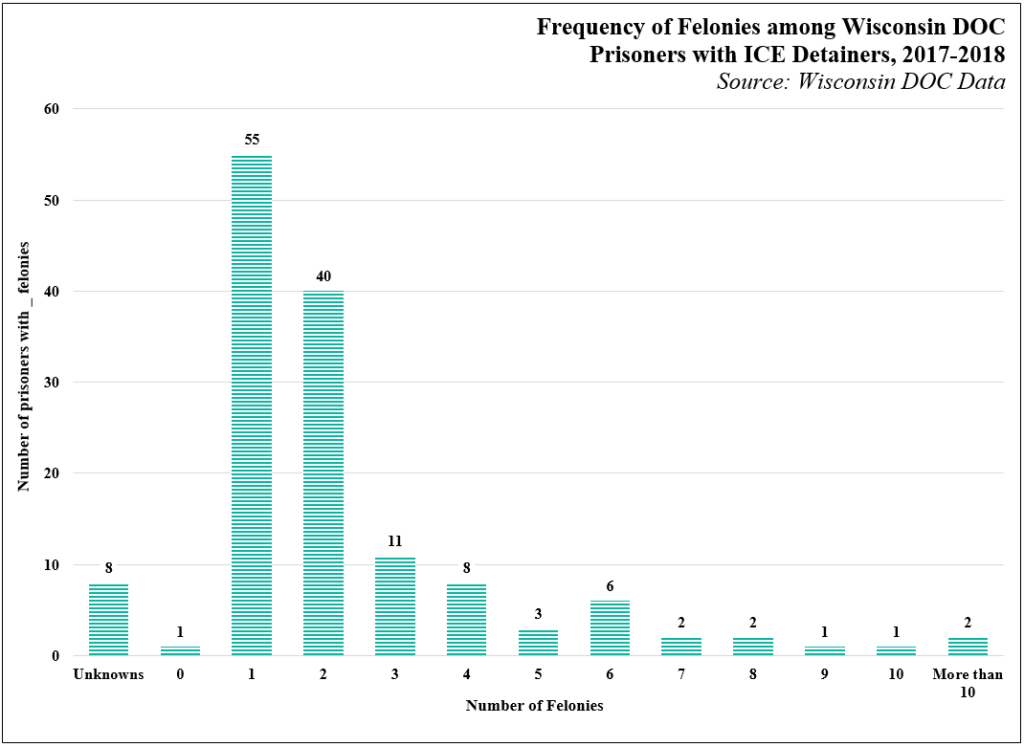
The data revealed that nearly every prisoner who was issued an ICE detainer between 2017-2018 was convicted of at least one felony.
In fact, most prisoners (55) had one felony, 40 prisoners had two felonies and 11 had three felonies. Outliers included one person with zero recorded felonies, two people with more than ten felonies and eight unknowns.
Sex Offender Registry Status, 2017
We noticed that most of the Wisconsin state prisoners who had been issued detainers were found guilty of committing a sex crime. Consequently, we decided to make two comparisons:
- Compare the number of overall prisoners* with detainers to the adult Wisconsin prison population
- Compare the number of prisoners with detainers who are registered sex offenders to the number of incarcerated Wisconsin prisoners who are registered sex offenders.
*The DOC data from their year in review does not specify which prisoner have detainers. Therefore, in determining percentages, we assumed the 98 was included in that figure (therefore, 98 out of 23,519 and 42 out of 6,048).
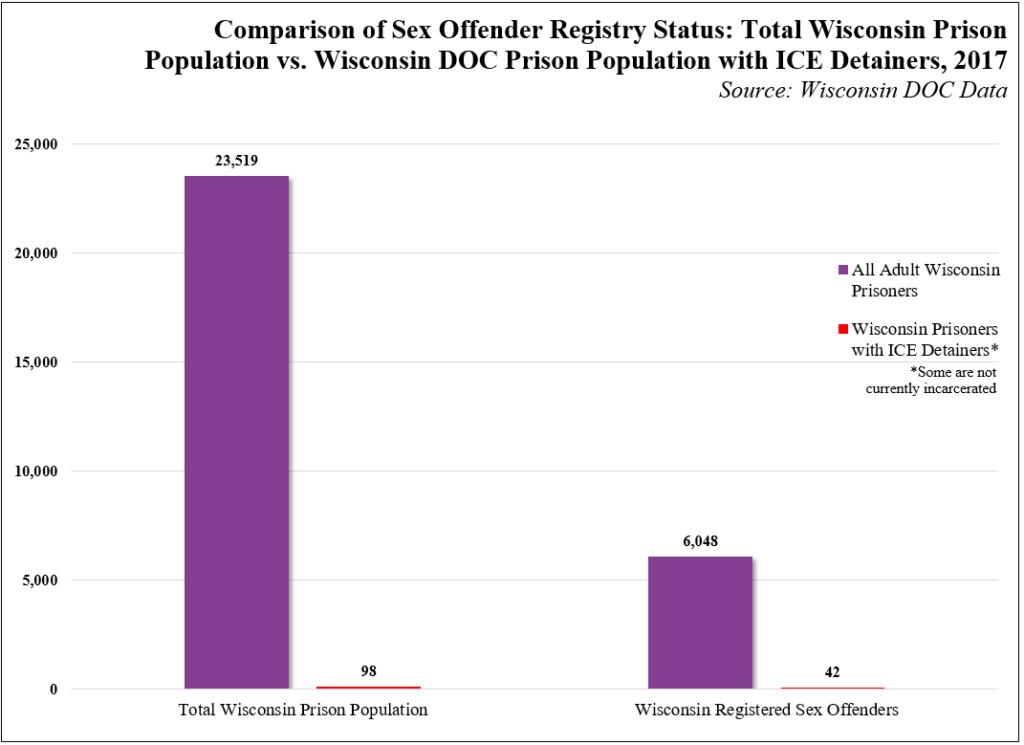
We found that Wisconsin prisoners with detainers made up 0.41 percent of the entire Wisconsin prison population.
In addition, Wisconsin prisoners with detainers who are on the sex offender registry make up 0.68 percent of Wisconsin’s incarcerated registered sex offenders. In context, the Wisconsin DOC noted that there are over 23,000 adults in the sex offender registry program.
Prison Population Comparison, 2014-2018
Using the DOC’s weekly population reports from the last weeks of 2014, 2015, 2016, 2017 and the most recent week of 2018 for which we data, we compared that to the number of the Wisconsin state prisoners with detainers for each corresponding year.
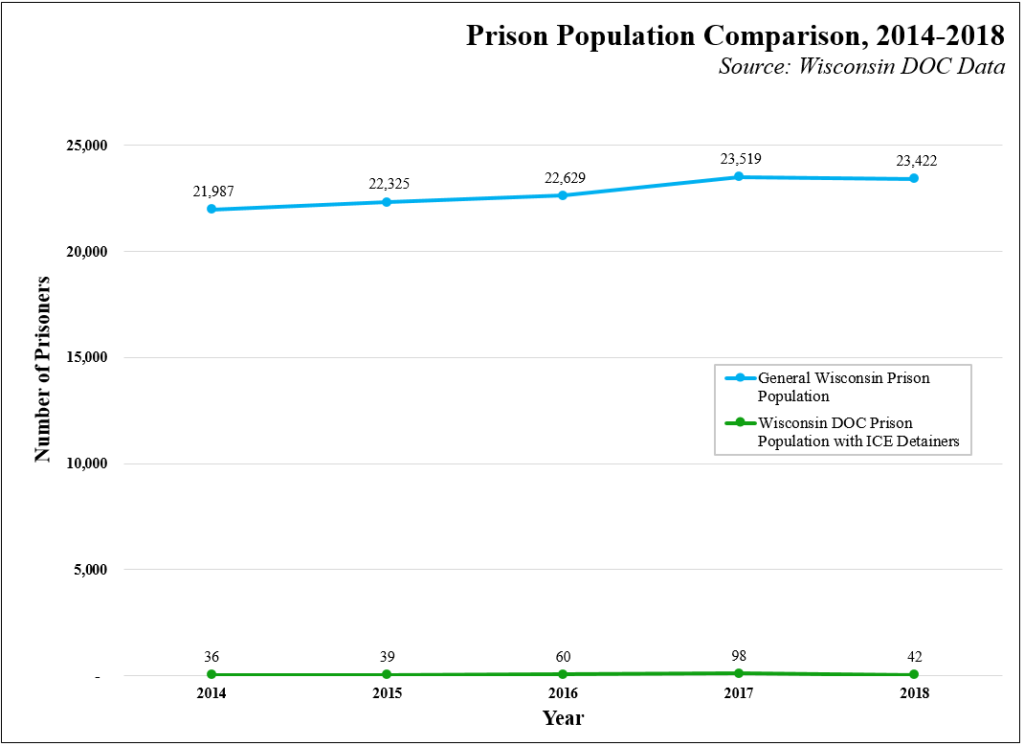
After conducting our comparison, we found that Wisconsin prisoners with detainers represented less than one percent of all Wisconsin prisoners.
- In 2014, they represented 0.16 percent of all Wisconsin prisoners
- In 2015, they represented 0.17 percent of all Wisconsin prisoners
- In 2016, they represented 0.27 percent of all Wisconsin prisoners
- In 2017, they represented 0.42 percent of all Wisconsin prisoners
- In 2018, they represented 0.18 percent of all Wisconsin prisoners
Detainers per Jail/County
The map shows how the areas with the most detainers (with the exception of Trempealeau) are concentrated in the eastern, and especially the southeast, portion of Wisconsin. Each dot represents a jail with the number of detainers as well as the county, city, jail name, jail address, and sheriff/warden/jail administrator. The information was compiled using TRAC data.
Data Sources:
- U.S. Census Bureau
- Syracuse University’s TRAC Data
- Prisoners with ICE Detainers: Wisconsin Department of Corrections Prison Data
- 2017 Wisconsin Incarcerated Sex Offenders: Wisconsin DOC 2017 A Year in Review
- 2017 Wisconsin Population Numbers: Wisconsin DOC Inmate Profile 2017
Please report any inaccuracies or typos.